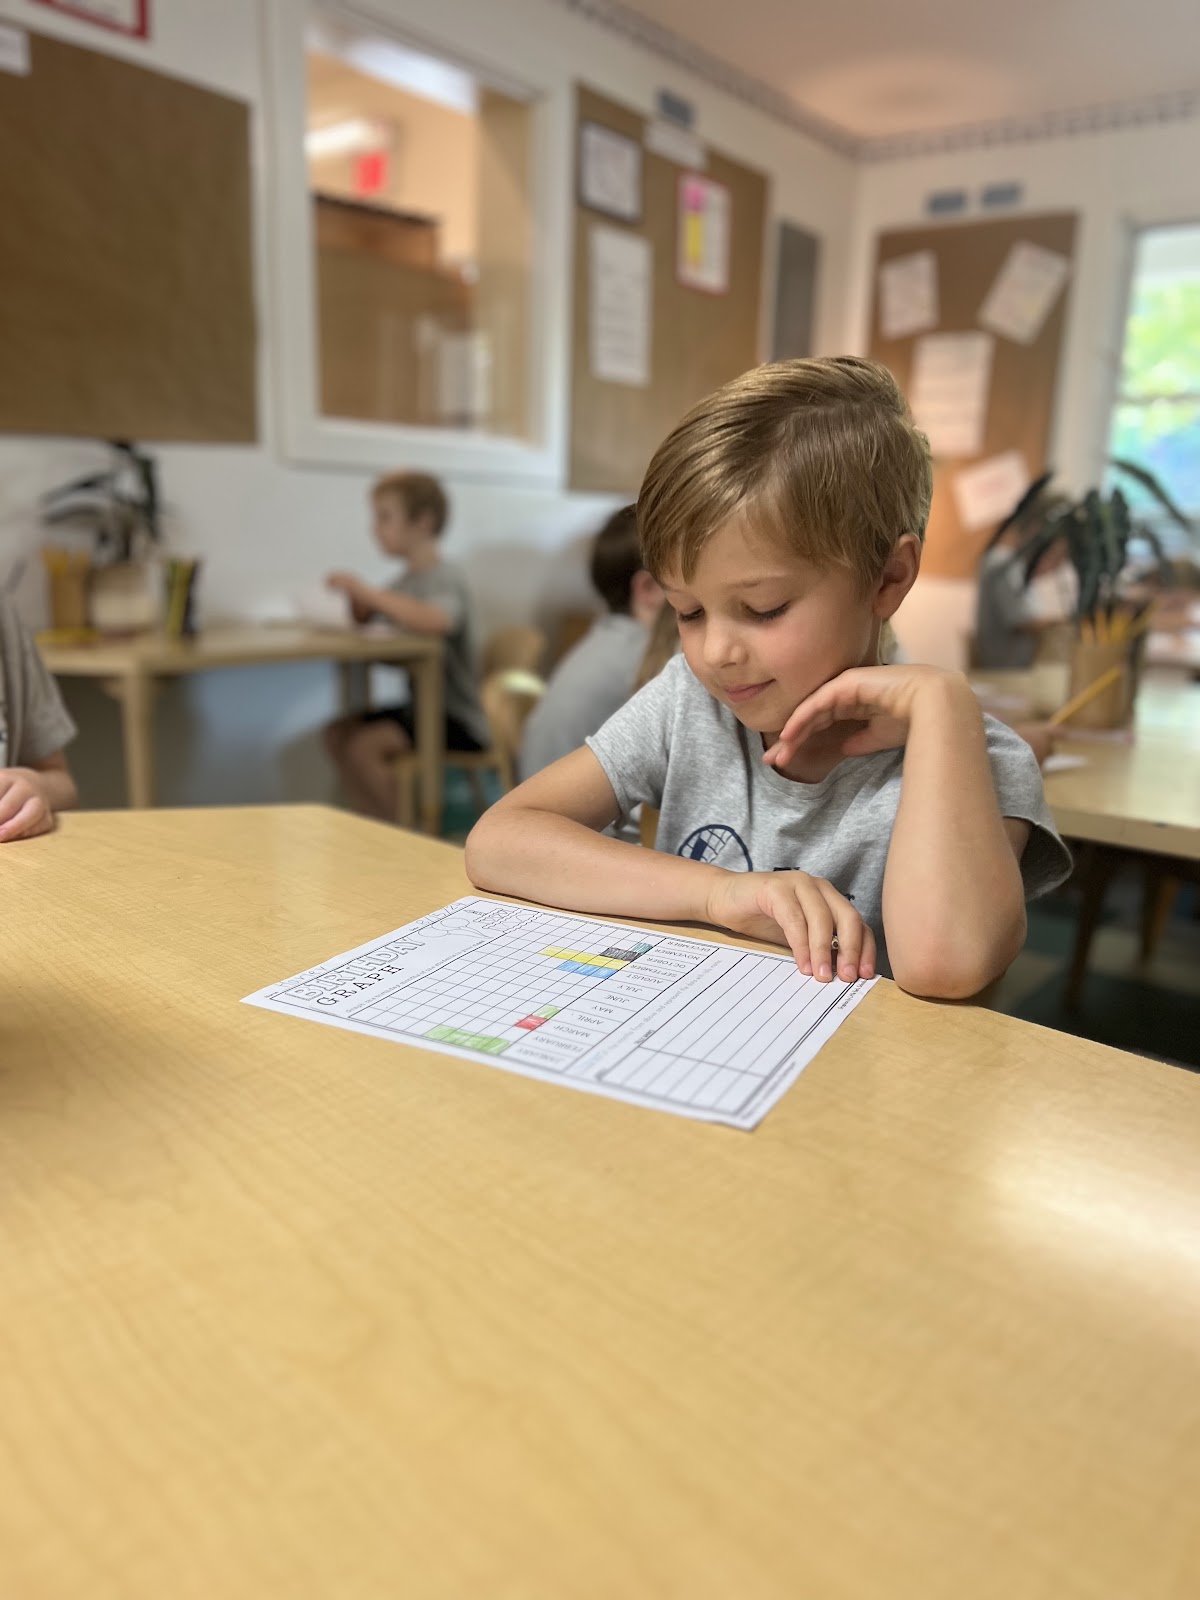
Reading a Graph
Second Grade started off their week recording each classmate’s birthday. After collecting data we created a bar graph of our birthdays. A bar graph is a picture that is made up of bars with different heights. Each bar represents a different category. The height of each bar can tell us how often something happens or show us the number of items we have for each group. As a class we used our birthday bar graph to compare data. Students learned which month had the most birthdays, which month had the least number of birthdays, and which months had no birthdays.
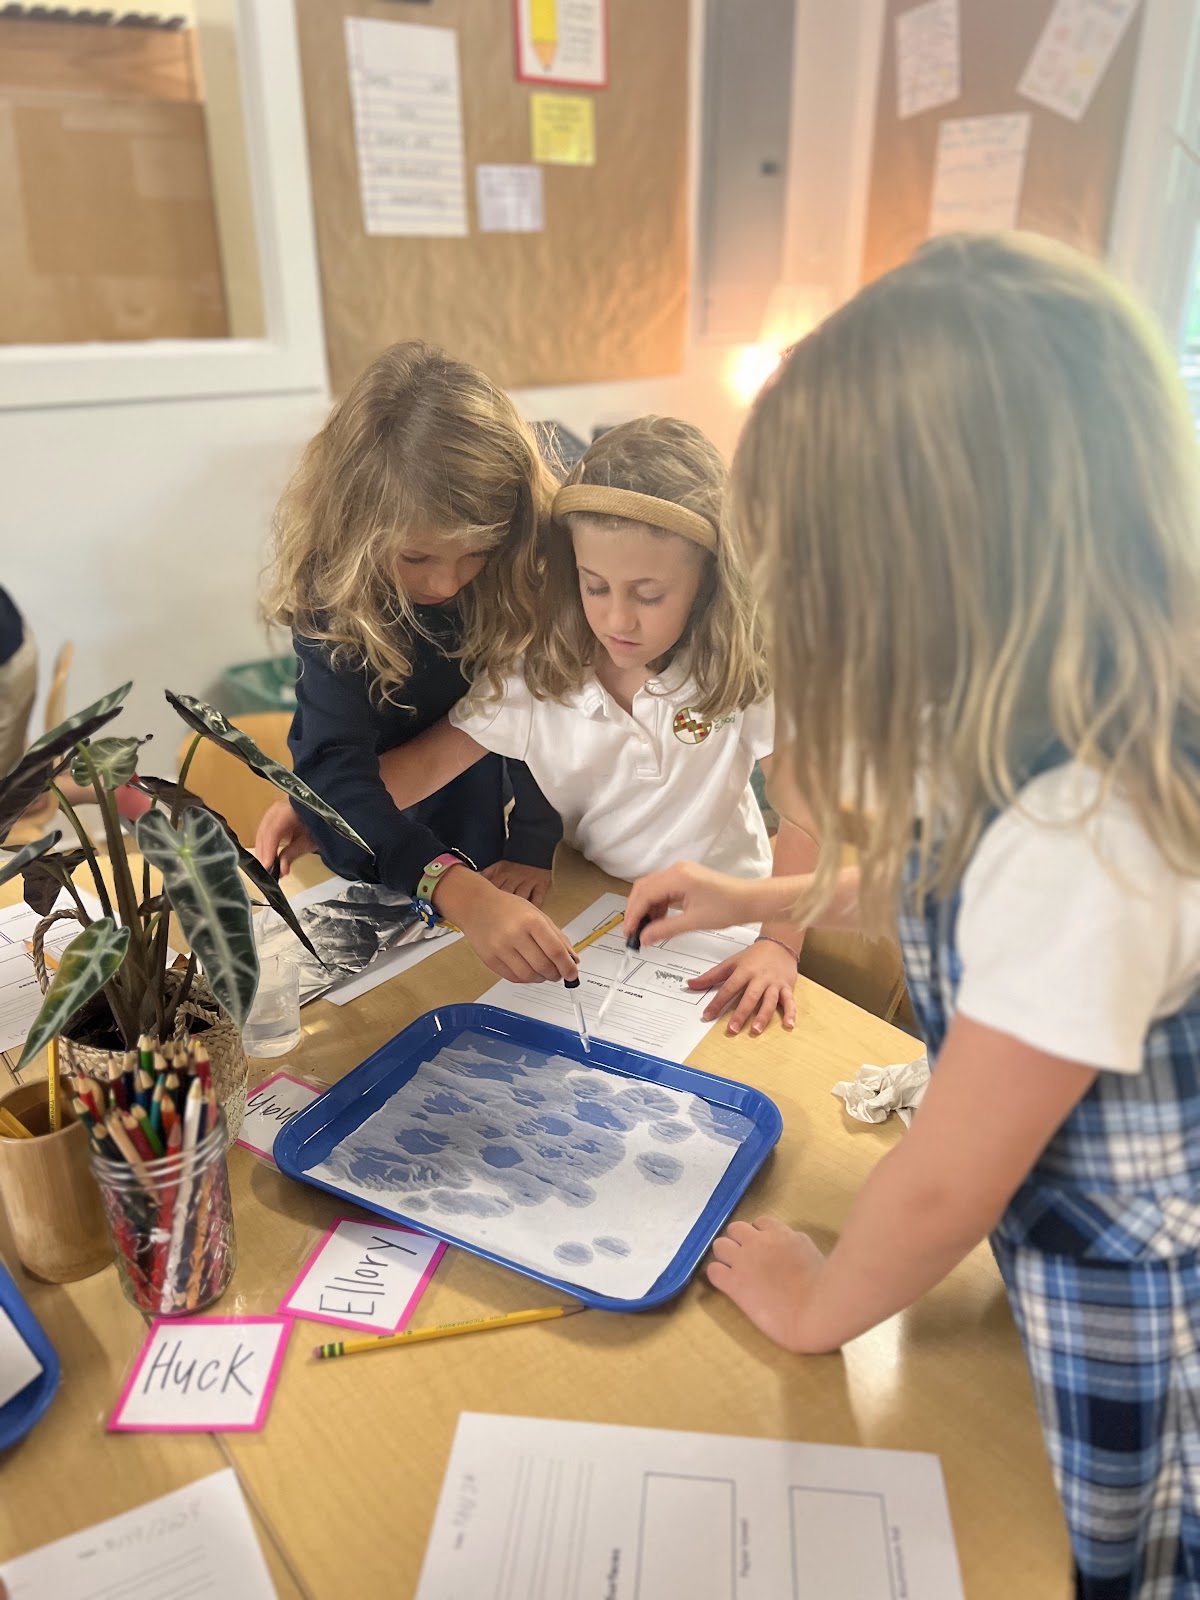
Water, Water, Water
This week we jumped right into science with lots of experiments. During this unit of science students will be focusing on water and climates. We experimented with water on different surfaces and with water on a slope. Second graders learned that water bubbled on wax paper, soaked into paper towels and paper, and slid off of foil. When we experimented with water drops on a slope we learned that you needed to use more than one droplet of water for it to slide down. This is because of surface tension. Second graders love science and we cannot wait to see what other experiments we will get to discover this year!
Small Moments
Students have been enjoying digging deep into their summer memories and pulling out their favorite small moments. Using these small moments second graders have written small moment stories. A small moment story is a personal narrative that focuses on a specific, meaningful moment in a person’s life. Our writers enjoyed listening to small moment stories written by their favorite authors and sharing their own small moment stories.

Important Dates:
- August 28th- Elementary Curriculum Night 5:30-6:30pm (Parents Only)
- September 2nd- No School (Labor Day)